- March 10, 2026
- Kishore Thutaram
- 0
Introduction
Debugging—ah, the secret sauce every ABAP developer needs to master. Writing code? That’s just the appetizer. The real feast begins when something goes sideways, and you need to play detective. Instead of throwing darts in the dark guessing where the bug is hiding, debugging lets you slow down time, peek inside your program, and figure out exactly what’s going wrong.
Ready to become a debugging ninja? Let’s break down the essential techniques to help you spot and squash bugs faster than ever.

What is Debugging in ABAP?
Think of debugging as your program’s reality check. It’s running the code line by line, watching variables like a hawk, and understanding the flow so you can catch those pesky errors hiding in the shadows.
The ABAP debugger is your trusty sidekick. It lets you:
- Pause the program mid-action
- Peek at variable values (no magic, just data)
- Keep an eye on internal tables
- Track the program’s journey step by step
- Hunt down logical slip-ups without guesswork
Instead of patching code blindly, debugging shines a spotlight on the exact moment and place things go wrong. Sweet, right?
Types of Breakpoints in ABAP
Breakpoints are like speed bumps for your program—they make it stop right where you want to take a closer look. Here’s the breakdown of the main types:
- Static Breakpoints: Set directly in the code with a quick F9. The program halts every time it hits that line.
- External Breakpoints: Perfect for apps triggered outside your editor—think SAP GUI, web services, or Fiori apps. They stick around for your user session.
- Conditional Breakpoints: These babies only trigger if a condition is met. For example, stop only when
lv_status = 'ERROR'. No more annoying stops on every loop iteration!
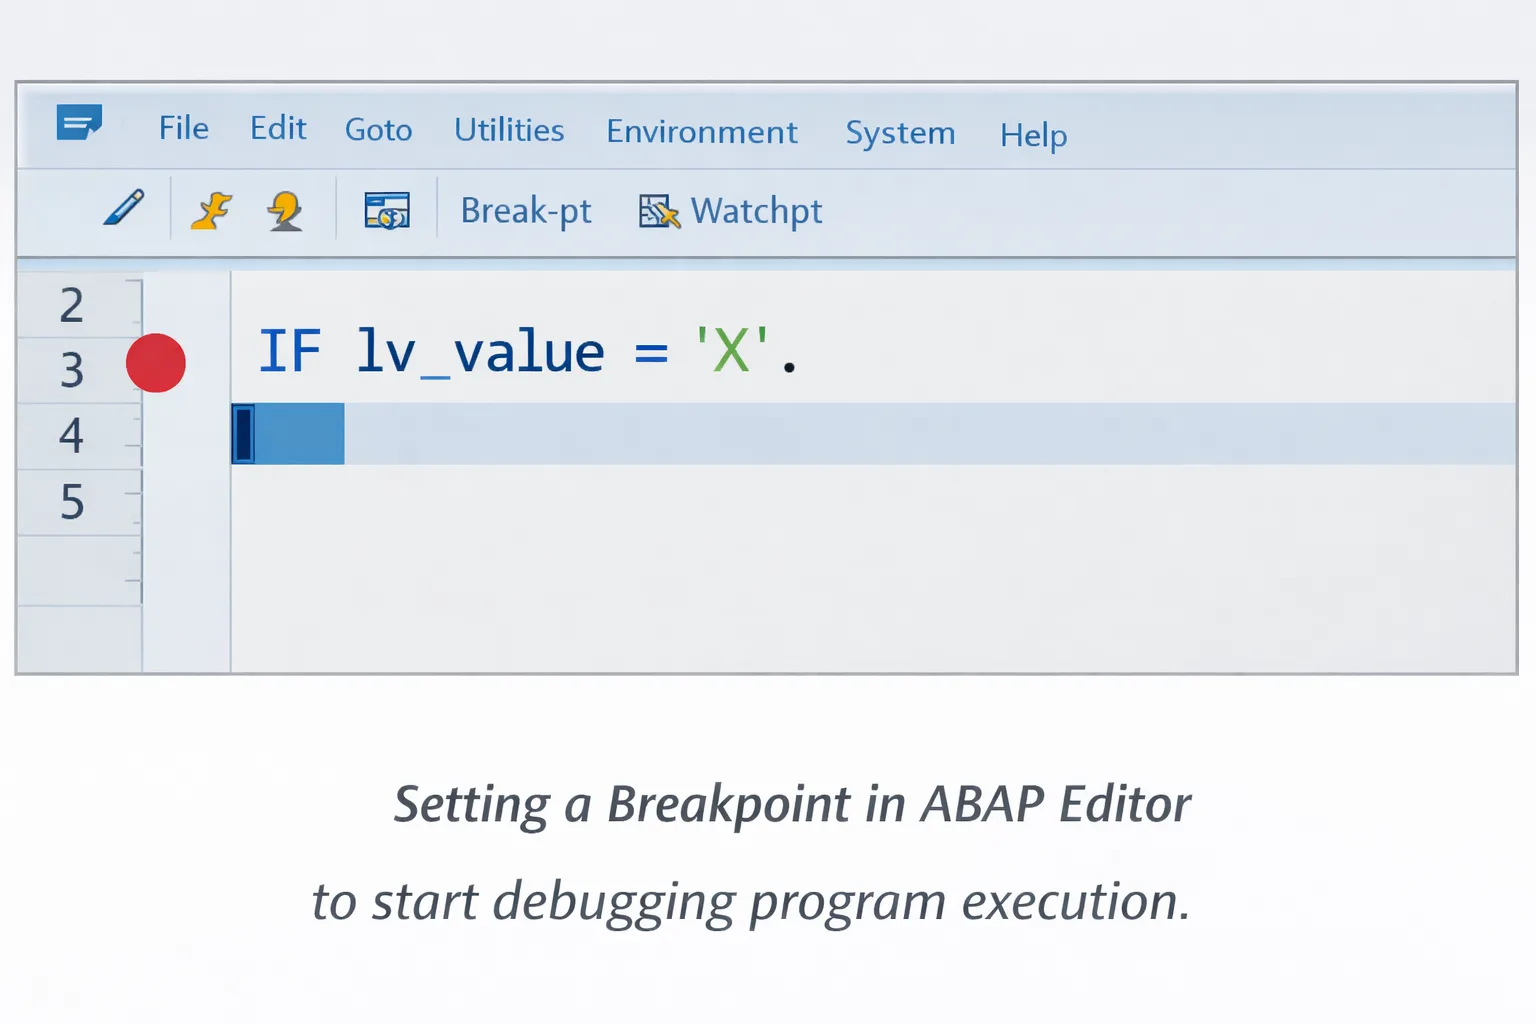
Setting Your First Breakpoint
To get started, open your program in SE38 or SE80, find the suspicious line, and drop a breakpoint.
Steps:
- Open your program in SE38.
- Navigate to the line where you want the program to pause.
- Hit the breakpoint icon or just press F9.
Now, when your program runs and hits that spot, the debugger jumps in to save the day.
Meet the ABAP Debugger: Your New Best Friend
Once the breakpoint hits, the debugger window pops open like magic. Here you can:
- Check current variable values
- Dive into internal tables
- Follow the execution flow
- Peek at the call stack
Use these handy keys to navigate:
- F5: Step into the next line (slow and steady)
- F6: Execute next line without entering subroutines (skip the small stuff)
- F7: Return from the current routine (time to back out)
- F8: Run until the next breakpoint (zoom through)
With these, you control the program’s pace and unravel what’s going on under the hood.
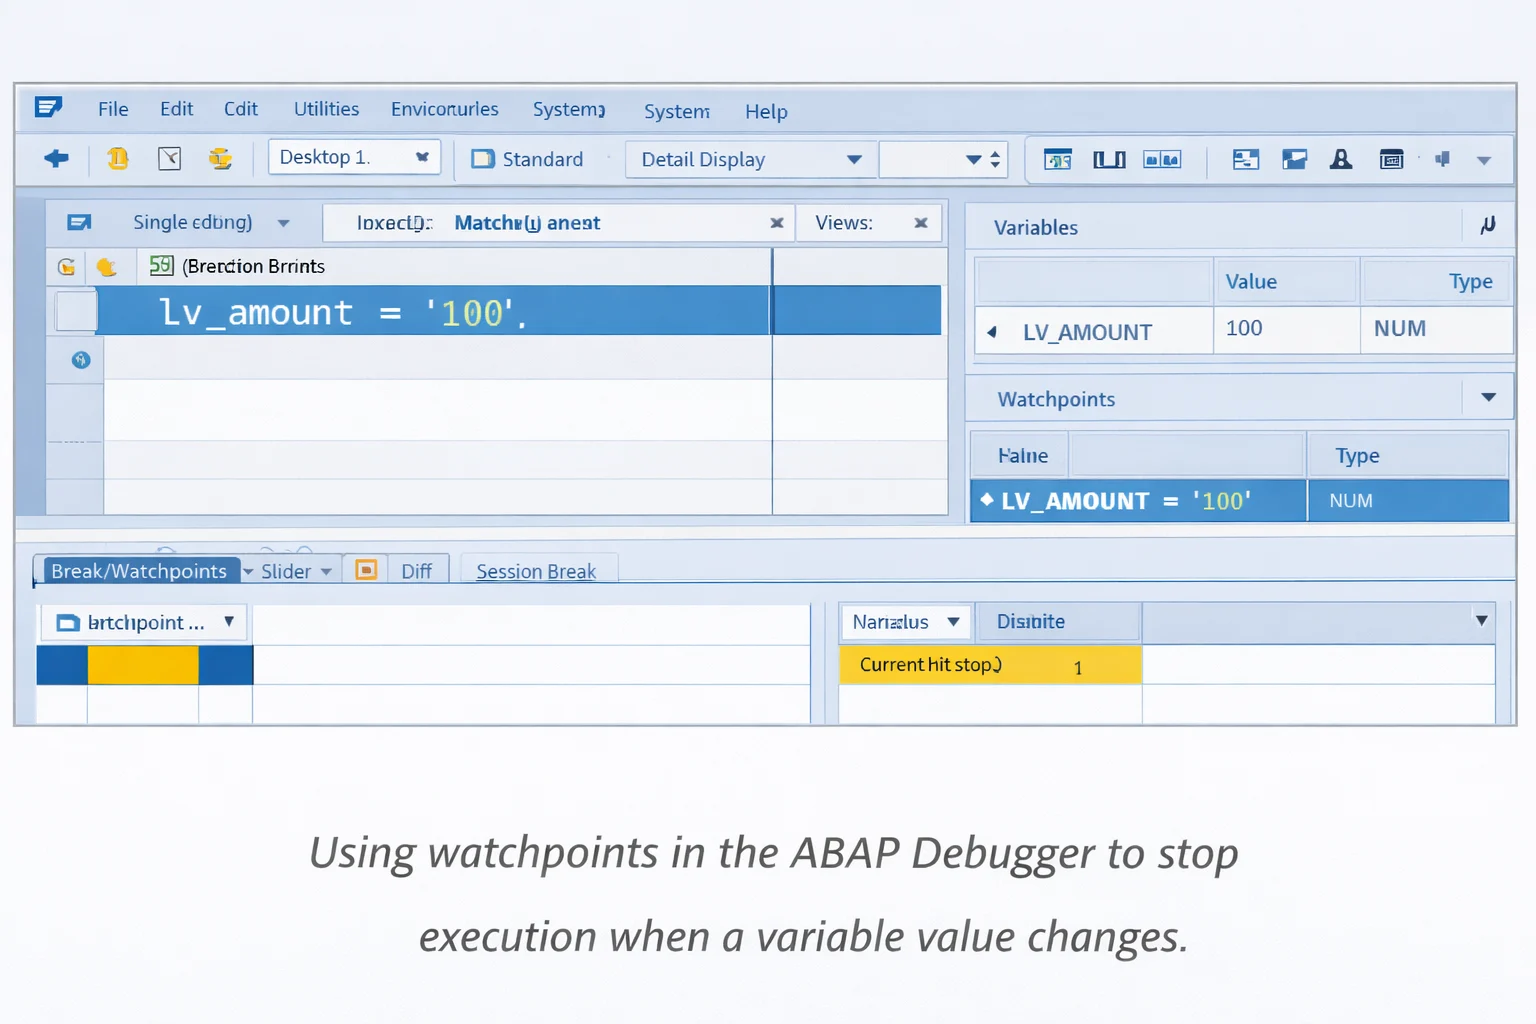
Watchpoints: The Watchdogs of Variables
Ever wish your program would stop exactly when a variable goes rogue? Enter watchpoints! They halt execution the moment a variable’s value changes.
Say you’re debugging pricing or sales orders—set a watchpoint on lv_amount, and boom, the debugger stops right when something fishy happens.
Debugging Background Jobs
Many SAP programs run as background jobs, especially in batch processing scenarios.
These jobs run without user interaction, so debugging them requires a different approach.
To debug background jobs:
Go to transaction SM37
Find the background job -> enter JDBG at Transaction code window
Put a break point at the program before execution
Once the job starts, the debugger will trigger when the breakpoint is reached.
Background debugging is particularly useful for analyzing:
Data migration programs
Financial batch jobs
Interface processing logic
Debugging BAdIs and User Exits
Got enhancements like BAdIs or user exits? Debugging these is a breeze:
- Set a breakpoint inside the BAdI Implementation class
- Set a breakpoint at Customer Exit’s include, if it is a Customer exit enhancement
- Set a break point at Form routine if it is User Exit enahcnemnet
- Trigger the related transaction
- Watch the debugger catch your enhancement in action
Great for confirming your sales order or delivery field updates are firing as planned.
Many enhancements in SAP are implemented through BAdIs, and debugging them helps you understand the execution flow. For a practical implementation example, see our article Update the Sales Delivery Field Values using BADI LE_SHP_DELIVERY_PROC.
Debugging IDoc Processing
When interfaces come into play, debugging IDocs is key:
- Open IDoc in WE02 or WE05
- Find the processing function module
- Set breakpoints inside that module
- Test it by using WE19/BD87 tool for Inbound IDOCS
- Run RSNAST00 program for outbound IDOCS
Now you can trace how data flows and transforms in your SAP system.
If you are working with IDocs and facing processing issues, debugging becomes very important. You can also refer to our detailed guide on Receive Sales Orders with IDOC, which explains how IDocs are enhanced and processed in SAP.
Handy Debugging Shortcuts
Speed up your debugging with these time-savers:
- F5: Step into the next line
- F6: Execute without entering routines
- F7: Return to previous level
- F8: Continue execution
- /h: Activate debugging before running a transaction
Master these and you’ll breeze through your debugging sessions.
Common Mistakes Developers Make
Even seasoned developers stumble sometimes. Watch out for:
- Breakpoints in the wrong program or include
- Forgetting to activate your code before testing
- Ignoring variable values and just stepping through code blindly
- Jumping into debugging without understanding the program flow first
Pause, think, then debug. It saves loads of headache.
Frequently Asked Questions
What is debugging in ABAP?
Debugging is the process of analyzing program execution step by step to identify and fix logical errors.
Which transaction is used for debugging?
Most debugging starts in SE38, SE80, or directly during transaction execution.
What is the difference between a breakpoint and a watchpoint?
A breakpoint stops execution at a specific line, while a watchpoint stops execution when a variable value changes.
Using AI to Debug ABAP Programs Faster
Modern developers are increasingly using AI tools to analyze code and debug faster.
AI tools can help with:
Understanding complex ABAP logic
Explaining runtime errors
Suggesting possible fixes for dumps
Reviewing code for logical mistakes
For example, developers often paste:
Short dumps from ST22
Error messages
Code snippets
into tools like ChatGPT to quickly understand the root cause.
AI can also help analyze:
complex SELECT queries
performance issues
confusing legacy code
While AI cannot replace debugging, it can significantly reduce investigation time.
🎉 Final Thoughts
Debugging isn’t just a chore—it’s your ticket to truly understanding how your ABAP programs tick. With breakpoints, watchpoints, and the debugger tools in your arsenal, you can tackle bugs head-on and build rock-solid SAP apps.
Keep practicing, and soon debugging will feel less like chasing ghosts and more like solving a fun puzzle. Happy debugging!

SAP Solution Architect | 16+ Years’ Experience in SAP | Sharing Practical SAP Knowledge | Engineering Graduate with Expertise in SAP Architecture