• March 13, 2026
  • Kishore Thutaram
  • 0

Introduction

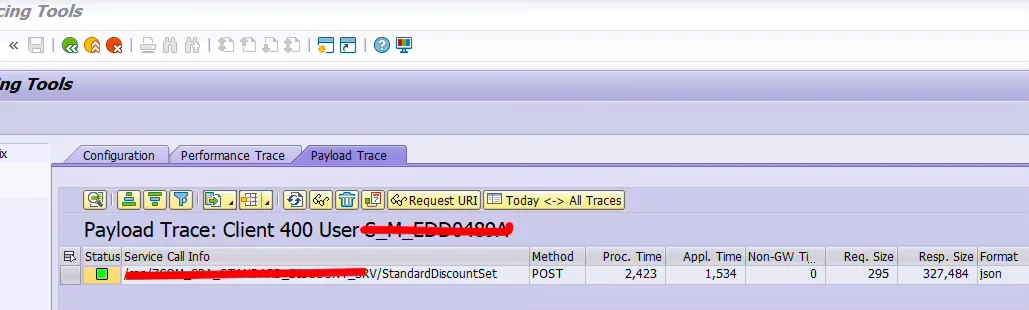
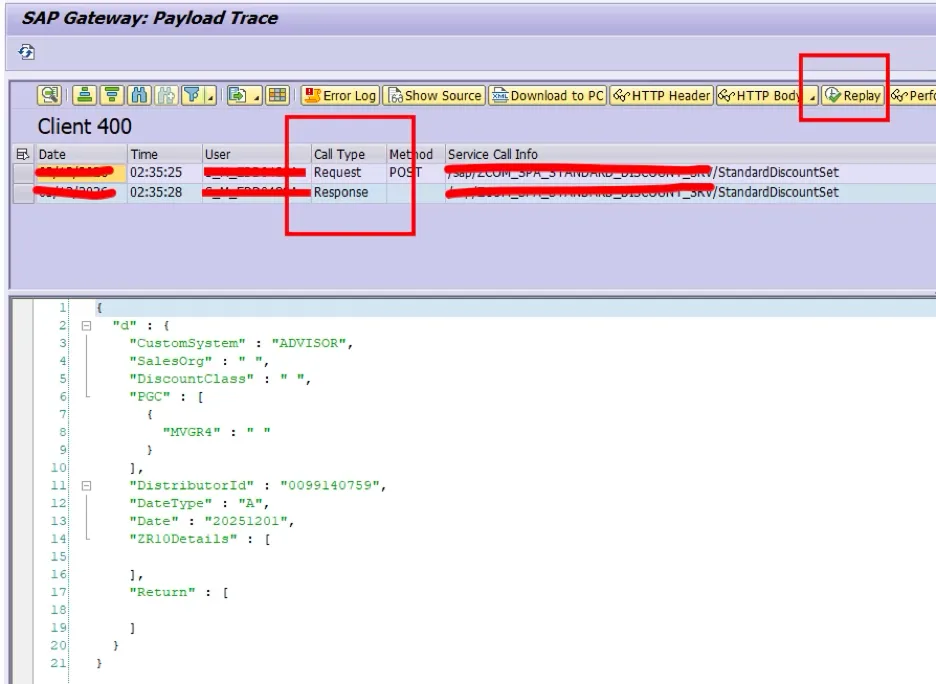
When working with SAP integrations and OData services, developers often need to analyze the payload exchanged between systems. The payload contains the request sent to SAP and the response returned by the backend service.

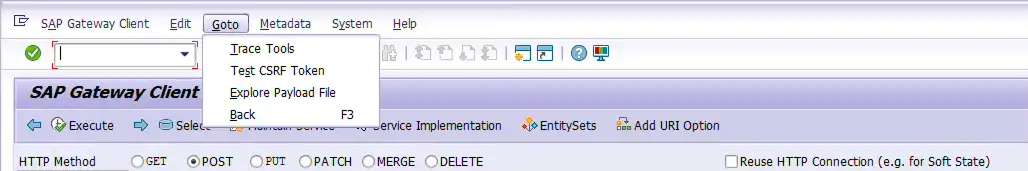
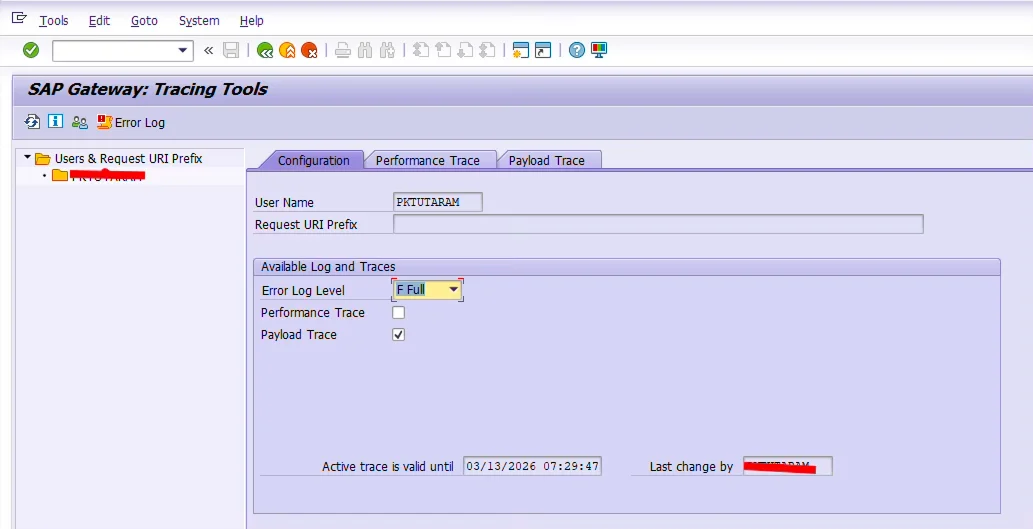
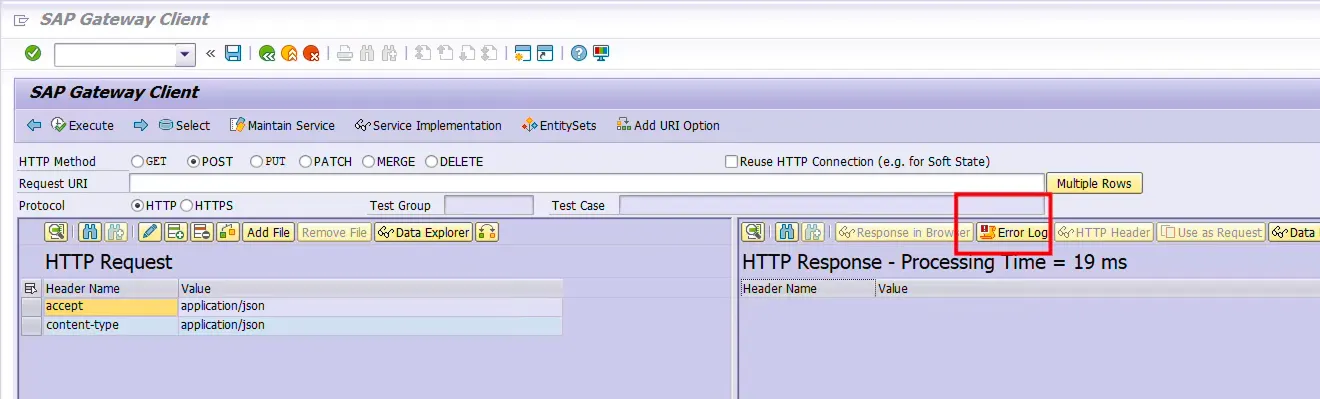
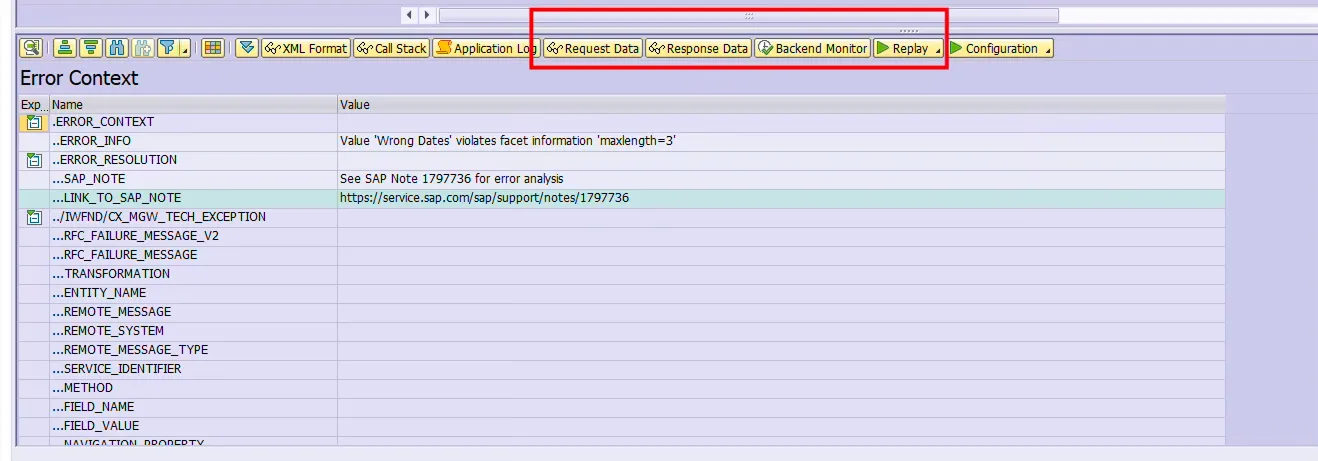
During troubleshooting, analyzing this payload helps identify issues such as incorrect data structures, missing fields, or unexpected responses from the service. SAP Gateway provides a built-in tool to capture this information using the /IWFND/GW_CLIENT transaction.

Trace OData payload in SAP Gateway using /IWFND/GW_CLIENT

Business Scenario

While testing integrations or Fiori applications, developers may need to capture the request and response payload of an OData service to troubleshoot issues occurring during the service execution.

Solution Overview

SAP allows tracing OData payloads through the Gateway Client tracing functionality.

Using this feature, developers can:

  • Capture request payload

  • Capture response payload

  • Replay OData calls

  • Analyze error logs

Payload tracing can be enabled temporarily to capture normal calls, while error calls are automatically logged by SAP Gateway.

Step 1: Open Gateway Client Transaction

Execute the transaction:

 /IWFND/GW_CLIENT
This transaction is the SAP Gateway Client, which is commonly used to test and monitor OData services.

From the menu navigate to:

 Goto → Trace Tools
screenshot

Step 2: Select User and Enable Payload Trace

In the Trace Tools screen:

  • The logged-in user will be selected by default.

  • If required, you can choose another user.

Right-click on Users & Request URI Prefix to select a different user for tracing.

Now click on:

Payload Trace

This enables payload tracing for the selected user.

screenshot
screenshot

Step 3: Trigger the OData Interface

After enabling the payload trace:

  1. Trigger the OData call from the external system

  2. This can be done through:

    • Postman

    • Third-party application

    • Fiori UI

    • Integration middleware

SAP will now capture the payload exchanged during this request.

screenshot

Step 4: View the Captured Payload

Return to the transaction:

/IWFND/GW_CLIENT

Open the Payload Trace option again.

You will now see the captured details of the OData call including:

  • Request Payload

  • Response Payload

  • Timestamp

  • Service details

You can analyze the data to identify issues in the integration.

screenshot

Step 5: Replay the OData Call

SAP Gateway provides a useful feature called Replay.

Using the Replay option, developers can:

  • Re-trigger the same OData call

  • Test responses again

  • Debug backend logic

This helps reproduce issues easily during troubleshooting.

Step 6: Capturing Payload for Error Calls

When an OData call fails, SAP automatically logs the payload without enabling tracing.

To view error payloads:

  1. Open transaction

/IWFND/GW_CLIENT
  1. Click on:

Error Log
  1. Select the required date range

You will see the list of failed OData calls.

The log contains:

  • Request Data → Input payload

  • Response Data → Output response

You can also use the Replay option from here to test the service again.

screenshot

Common Mistakes Developers Make

Forgetting to enable payload trace
Normal OData calls will not store payload unless tracing is enabled.

Tracing wrong user
Ensure that the trace is activated for the correct user executing the service.

Not disabling trace after testing
Leaving trace enabled for long periods may impact system performance.

Ignoring error logs
Many developers miss checking the Gateway error log where failed payloads are already stored.

Frequently Asked Questions

1. What is the purpose of payload tracing in SAP Gateway?
Payload tracing helps capture the request and response data of an OData service to troubleshoot integration issues.

2. Which transaction is used to trace OData payload in SAP?
The transaction /IWFND/GW_CLIENT is used to trace and analyze OData payload in SAP Gateway.

3. Can we capture payload for failed OData calls without enabling trace?
Yes, SAP automatically logs payload details for failed OData calls in the Gateway Error Log.

🎉 Final Thoughts

Tracing OData payloads is an essential skill for SAP developers working with Fiori apps, APIs, and system integrations. The Gateway Client tracing feature provides a simple yet powerful way to capture and analyze request and response data.

By using payload tracing and error logs effectively, developers can quickly identify integration issues and resolve them without deep debugging.

Useful links

  1. You can also explore effective debugging techniques in ABAP in our article How to Debug ABAP Programs Effectively.
  2. If you are working with integrations, see how Sales Orders can be received using IDOC extensions in Receive Sales Orders with IDOC Extensions.
  3. If you are building Fiori-based solutions, you may also like Fiori Tile Creation on GUI Transaction.
Share article

Kishore Thutaram

SAP Solution Architect | 16+ Years' Experience in SAP | Sharing Practical SAP Knowledge | Engineering Graduate with Expertise in SAP Architecture

https://fiowelt.com

Leave a Reply

Your email address will not be published. Required fields are marked *